

I was planning to build a web based temperature/humidity monitoring app with Raspberry PI 3 and Windows 10 IoT Core. I have playing around with Raspbian for a while now and this time I wanted to try something different. I have been using Python to write application for Raspberry PI, Windows IoT Core with C# will be something new for me and therefore, this time I choose to go with Windows 10 IoT Core.

Here is the list of things to get started:
- Raspberry PI 3 with Windows 10 IoT Core
- Adafruit BME280 Temperature Humidity Pressure sensor
- Jumper wires
- Power Bank
- Visual Studio 2015⁄2017
- IoT Dashboard
- Azure account
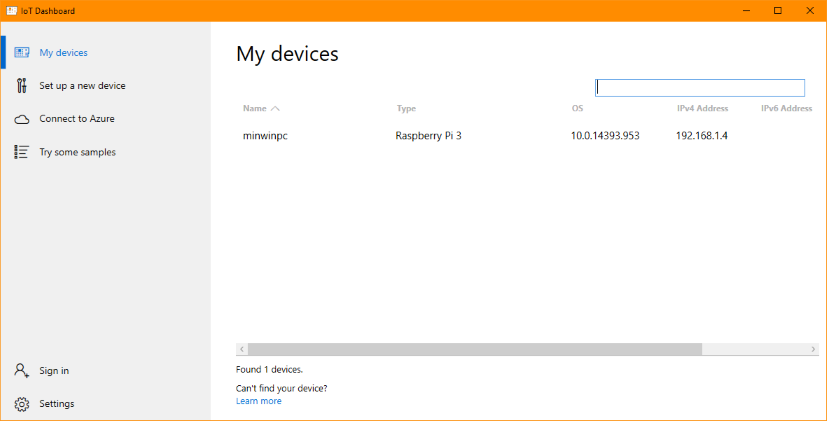
Setting up the PI with Windows 10 IoT Core is a very straight forward process. You can read about it more here. I recommend to connect the device to your Wi-Fi network. This will give you a benefit to move your device around. The problem for the first time users will be that the device will not auto-connect to the Wi-Fi network. To solve this problem, you need to use a wired LAN connection from the network or from the local computer. Once plugged in you will be able to see the device in the IoT dashboard from where you can go to Device Portal and connect to the Wi-Fi network. After the connection is successful, you can then remove the LAN cable. To follow the exact steps, head over to this documentation. This is how your device will get displayed in the IoT dashboard.
Getting things ready in Azure
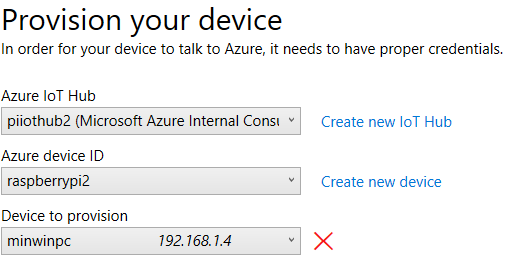
You can set up things in the cloud from the Azure Portal as well as from the IoT Dashboard itself. From dashboard you can create and provisioned a new IoT Hub and register the device in that Hub. Here is how you can do that. First sign-in to your Azure account by clicking the Sign-In option in the left hand side bar. After the sign-in is successful, you will be prompted with the below screen where you can provision a new IoT Hub and add your current device in the hub.
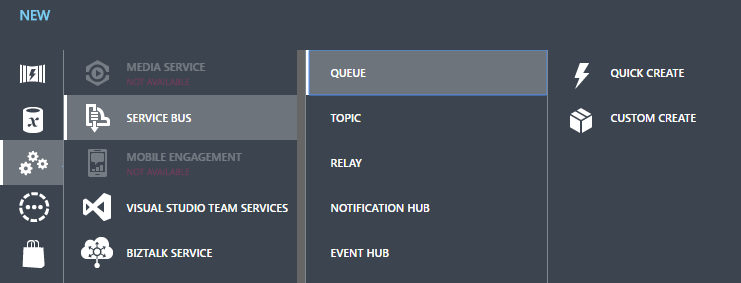
I am skipping the step for setting the IoT Hub from the Azure Portal as there is a good documentation available at Azure Docs. Pushing data to the IoT Hub with the SDK is easy but you can’t make use of the IoT Hub alone to read that data and do your work. Therefore, you also need to set up a Queue to read that data. As of now, you cannot create a Queue from the new Azure Portal instead you have to head towards the old portal at manage.windowsazure.com and create a queue from there. To create a queue, click the New>App Services>Service Bus>Queue>Quick Create. Fill in the details to create a new queue.
Make sure that the region you are selecting here for the queue, it should be the same as your IoT Hub region. If you select a different region than that of your IoT Hub, you will not be able to associate this queue with the hub endpoint.
In the Azure Portal, to associate this queue with the IoT Hub endpoint, click the Endpoints and then click Add to add the queue to the endpoint.
Setting up the circuit
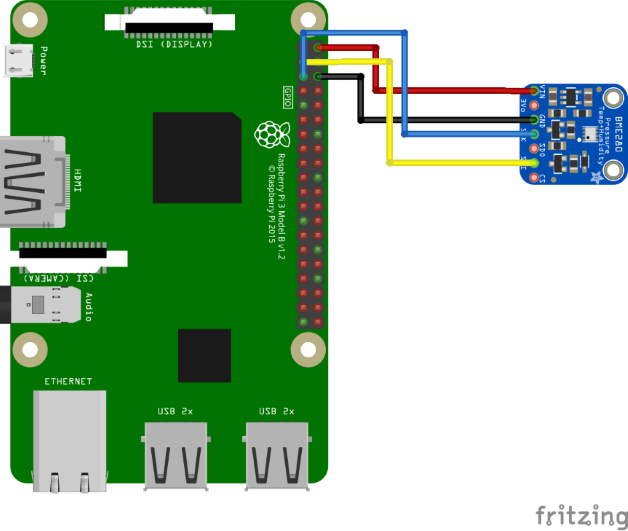
Now as you have the device and the OS ready, you can now build the circuit. The BME280 sensor can be used with both I2C and SPI. For the project, I am using I2C. Below is the Fritzing diagram for your reference. You can download the Fritzing sketch file on Github repo.
Creating Device Application
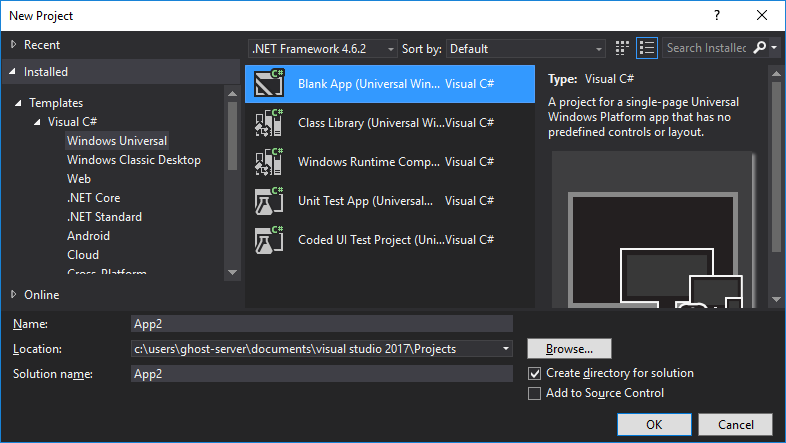
I am using Visual Studio 2017 Enterprise Edition to build the device application and the web monitor application which I will be hosting in the cloud. For creating the device application, start with selection the Windows Universal project templates and then select Blank App (Universal) template.
There is a project template available for Visual Studio which will let you build applications for Raspberry PI. The problem with that project type is that you will not be able to make use of the libraries or the SDK available for .NET yet. You can still build applications with this project type but you have to make use of REST API and using REST API is not as straight-forward as SDKs.
After the project creation is successful, you need to add below dependencies which will let you connect to IoT Hub and have a device to cloud communication. Below are the NuGet packages you need to install.
This package will enable you to have a device to cloud communication.
Install-Package BuildAzure.IoT.Adafruit.BME280
This package is the wrapper for the BME280 sensor.
Install-Package Microsoft.Azure.Devices.Client
Add the below namespaces in the Main.xaml.cs file.
using Newtonsoft.Json;
using Microsoft.Azure.Devices.Client;
using BuildAzure.IoT.Adafruit.BME280;
Declare the variables.
private DeviceClient _deviceClient;
private BME280Sensor _sensor;
private string iotHubUri = "piiothub.azure-devices.net";
private string deviceKey = "Tj60asOk5ffVAT6a6SvZKMOqo8DYKSwWV7eQ2pLf0/k=";
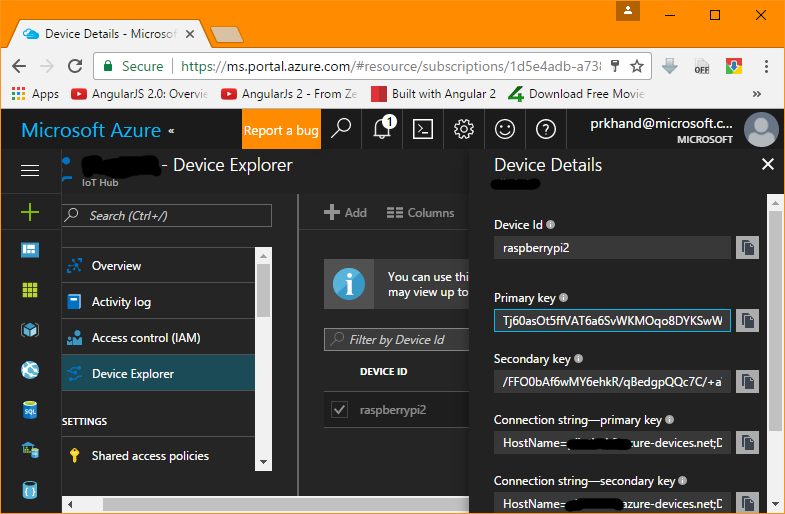
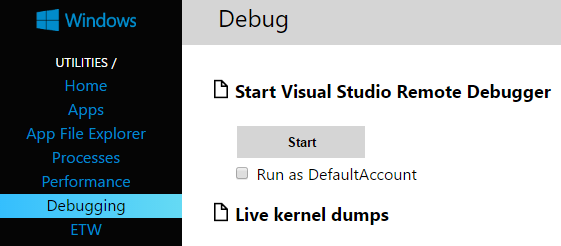
The iothuburi is the URL for the IoT Hub created in the Azure portal or from the IoT dashboard. You can get the device key from the Device Explorer section in the IoT Hub. You can see how to get the Key from the Device Explorer from the below screen shot. I am using the Primary Key as a devicekey in my code.
In the constructor, initialize the DeviceClient and BME280Sensor objects. I have commented out the InitializeComponent(), but if you want you can keep it as it is.
public MainPage()
{
    //this.InitializeComponent();
    deviceClient = DeviceClient.Create(iotHubUri, new DeviceAuthenticationWithRegistrySymmetricKey("raspberrypi", deviceKey), TransportType.Mqtt);
    _sensor = new BME280Sensor();
    DeviceToCloudMessage();
}
Now add a function named DeviceToCloudMessage which will connect to the IoT Hub using the device key, read the sensor data, serialize the data in JSON format and send it to the IoT Hub. Add this at the very bottom of the constructor.
private async void DeviceToCloudMessage()
{
    await _sensor.Initialize();
    float temperature = 0.00f;
    float humidity = 0.00f;
    while (true)
    {
        temperature = await _sensor.ReadTemperature();
        humidity = await _sensor.ReadHumidity();
        var sensorData = new
        {
            date = String.Format("{0}, {1}, {2}",
                                 DateTime.Now.ToLocalTime().TimeOfDay.Hours,
                                 DateTime.Now.ToLocalTime().TimeOfDay.Minutes,
                                 DateTime.Now.ToLocalTime().TimeOfDay.Seconds),
            temp = Math.Round(temperature, 2),
            humid = Math.Round(humidity, 2)
        };
        var messageString = JsonConvert.SerializeObject(sensorData);
        var message = new Message(Encoding.ASCII.GetBytes(messageString));
        await deviceClient.SendEventAsync(message);
        //Debug.WriteLine("{0} > Sending message: {1}", DateTime.Now, messageString);
        Task.Delay(5000).Wait();
    }
}
The date property in the sensorData type is being set in this specific way because we want to see the graph continuously moving. I can also read Pressure from the sensor but as I am not interested in showing this data, I am skipping it out. If you want you can use it but you also have to change the web app to show this reading. Before I can send this data to the IoT Hub, I am serializing the sensorData object and use ASCII encoding to get the byte[] and pass it to the Message class constructor. The last step is to send the message to the hub by using the DeviceClient class SendEventAsync method. In the last line I am adding a delay of 5 seconds between each reading. You can increase the time and see how the chart renders. I recommend not to go below this time delay as this might give you some false readings from the sensor.
I took this code from the documentation here and tweaked it to have the real data from the sensor connected to the device. Press Ctrl+Shift+B to build the solution. Navigate to Project and then click <project> Properties. Under Debug section, set the Start Options as shown below. Notice that the Platform is set to ARM and Configuration is Active (Debug). When you are done with debugging the code and ready to deploy the code to the device you need to change it to Release.
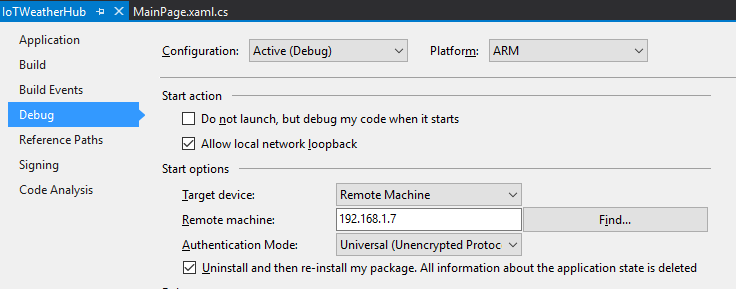
Unlike Raspbian, where we ssh or RDP into the device and compile or build the code, Windows 10 IoT works in a different way. You need to remote deploy the application from Visual Studio. Also, if you have enabled the remote debugging on the device, you also have to add the port number to the Remote Machine value and set the Authentication Mode to None.
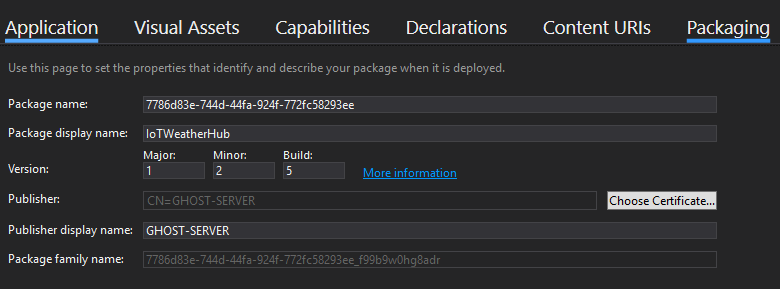
NOTE: When you make changes to device application, you also need to change/increment the version of the application in the Package.appxmanifest file. If you miss this step then the application deployment will fail.
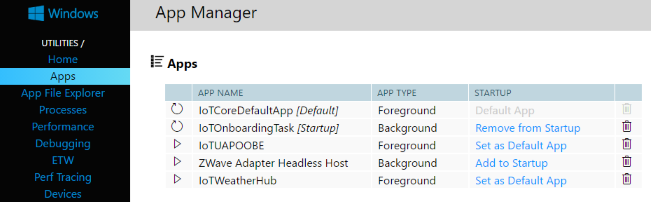
To deploy the app to the device, click the Build menu and select Deploy <Project Name>. If you are deploying the application for the first time, it will take some time to get deployed. After the deployment is successful, you will see the application under the App section. At this moment, the application is stopped. To start the application in the, click the Play button in the list to start the application. The App Type show the type of application or you can say the mode it is running on. When I created the application, I selected the UWP application and therefore, it will always run in the Foreground type. The reason I choose this application type (UWP) is because I can then use the SDK to communicate with the IoT Hub. If you want to create a Background application type then you can download this Visual Studio Extension for 2017 and this for Visual Studio 2015 which will let you build the background application. Keep in mind that you cannot use any SDK library with this project type. All you have now is the power of REST API which is not very easy to use.
Setting the Web App
You can build any kind of app to visualize the data, but because the SDK support for .NET is good I am going to set up a simple MVC application using .NET Framework. As of now, you cannot use Azure SDK with .NET Core application and also it looks like the team does not have any plans to shift their focus for releasing the SDK for .NET Core anytime soon.
Start with installing NuGet packages. First with the package that will let you read the data from the Queue.
Install-Package WindowsAzure.ServiceBus
Because this is a real-time application you also need to install SignalR
Install-Package Microsoft.AspNet.SignalR
After these packages are installed, You need a way to visualize the temperature and humidity received from the queue. To do this you can use any jquery chart plugin or any other library of your choice. I will be using Google Charts in my app, Line Charts to be precise. Installation is straight forward for the charts and you can play around with different options to tweak the look and feel of the chart. I am going to add the chart code in the Index.cshtml file. Below is the complete code for the chart to render.
<script type="text/javascript" src="https://www.gstatic.com/charts/loader.js"></script>
<div id="chart_div"></div>
<script>
    var data = [];
    var chart;
    google.charts.load('current', { packages: ['corechart', 'line'] });
    google.charts.setOnLoadCallback(loadChart);
    var hub = $.connection.ioTHub;
    $.connection.hub.start();
    hub.client.iotHubNotification = function (d) {
        console.log(d);
        var pi = JSON.parse(d);
        var time = pi.date.split(',');
        var temp = pi.temp;
        var humid = pi.humid;
        data.addRows([[[parseInt(time[0]), parseInt(time[1]), parseInt(time[2])], temp, humid]]);
        var options = {
            height: 250,
            hAxis: {
                title: 'Time'
            },
            vAxis: {
                title: 'Temperature / Humidity',
                gridlines: { count: 22 }
            }
        };
        chart.draw(data, options);
    };
    function loadChart() {
        data = new google.visualization.DataTable();
        data.addColumn('timeofday', 'Time');
        data.addColumn('number', 'Temperature');
        data.addColumn('number', 'Humidity');
        var options = {
            height: 250,
            hAxis: {
                title: 'Time'
            },
            vAxis: {
                title: 'Temperarture / Humidity',
                gridlines: { count: 22 }
            }
        };
        chart = new google.visualization.LineChart(document.getElementById('chart_div'));
        chart.draw(data, options);
    }
</script>
I make use of the sample code from the examples at Google Charts and used it along with some minor tweaks to suite my needs. loadChart() function is called for the first time when the page is loaded and then I have a SignalR hub which updates the chart with the same option sets that I have in the loadChart() function. I add 3 data columns to display the data in the chart. There are few things that I would like to talk about in the above code. First is the timeofday is displayed on a X-Axis because time is continuous and I want to update the chart with time. Second, the gridlines property of the vAxis let you set how many horizontal rows you want to see in the graph. I have increased it to quite a significant number because I want to see the graph in more detail. You can play around with these settings and see what looks better for you. Third, the response I receive in the hub is in string format and therefore, I have parsed that string to JSON in order to read it and set to the rows. Also note that I have leave the console.log in the above code so that when you run the web app you can see the raw data in the console.
In the HomeController.cs, first I will set the connection string to the queue which I have associated with the IoT Hub endpoint in Azure and set the queue name along with the IHubContext for SignalR communication.
private string connectionString = "Endpoint=sb://iothubqueue-ns.servicebus.windows.net/;SharedAccessKeyName=RootManageSharedAccessKey;SharedAccessKey=88kJcD1mvJnO1jtiiY+AcUtIoinW//V/lF2WicOJ50s=";
private string queueName = "iothubqueue";
private IHubContext _hubContext;
In the constructor, initialize the IHubContext object.
_hubContext = GlobalHost.ConnectionManager.GetHubContext<IoTHub>();
Here is the code for the IoTHub class:
using Microsoft.AspNet.SignalR;
namespace IoTHubTempWebApp.Hubs
{
    public class IoTHub : Hub
    {
        public void IoTHubNotification(string value)
        {
            Clients.All.iotHubNotification(value);
        }
    }
}
And the code for Startup class (Startup.cs)
using Microsoft.Owin;
using Owin;
[assembly: OwinStartup(typeof(IoTHubTempWebApp.Startup))]
namespace IoTHubTempWebApp
{
    public class Startup
    {
        public void Configuration(IAppBuilder app)
        {
            app.MapSignalR();
        }
    }
}
In the Index ActionResult, I will start a task which will read the messages from the queue and then SignalR will broadcast it to the client side which in turn update the chart with the latest data or temperature/humidity readings.
public ActionResult Index()
{
    Task task = Task.Run(() =>
    {
        QueueClient client = QueueClient.CreateFromConnectionString(connectionString, queueName, ReceiveMode.ReceiveAndDelete);
        client.OnMessage(message =>
        {
            Stream stream = message.GetBody<Stream>();
            StreamReader reader = new StreamReader(stream, Encoding.ASCII);
            string s = reader.ReadToEnd();
            _hubContext.Clients.All.ioTHubNotification(s);
        });
    });
    task.Wait();
    return View();
}
First I create a QueueClient object with the connection string and queue name along with the ReceiveMode. I have set ReceiveMode to ReceiveAndDelete as I want to delete the data from the queue once it has been read. Though you have an option to have the data in the queue for the maximum of 7 days in Azure. The QueueClient has an OnMessage event which process a message in an event-driven message pump, which means that as soon as the something is being added to the queue, this event is fired. I get the message body in the form of Stream, read the message to the end and pass the message to SignalR hub which in turn updates my chart in real-time. Here is the final output I have now.
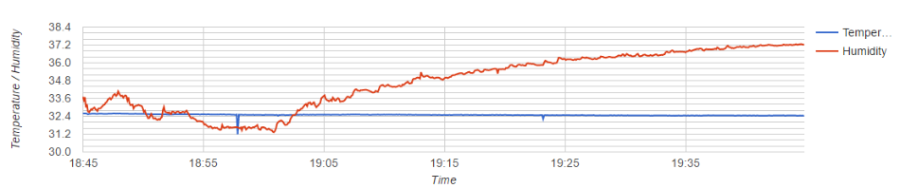
If you look closely, you will notice that the temperature line is not as smooth as you thought it would be. This is because every time when Raspberry PI read the data from the sensor there is a slight change in the temperature only with a few decimal places. If you don’t like this then you can change the gridlines property of the vAxis in the chart. Also you can try changing the time delay on the device to see if that impacts the lines on the chart. try changing both time delay in the device application and the gridlines in the web application to see how the chart renders.