

In the past decade Marvel has gathered a lot of fans following which eventually led all the fans to know more about how the Marvel comics universe characters, stories, events are mapped or linked to each other.
In 2017 (if I am remembering it correctly), at Microsoft Build event, Microsoft announces Bot framework and did a demo with CosmosDB graph database which uses Gremlin query from Apache TinkerPop. It was a great demo, and I was really impressed by how they did it but unfortunately, I was unable to find the source code for that demo anywhere. So, I thought I should at least get the graph database for my own use and then sometime later will work on building a NLU bot.
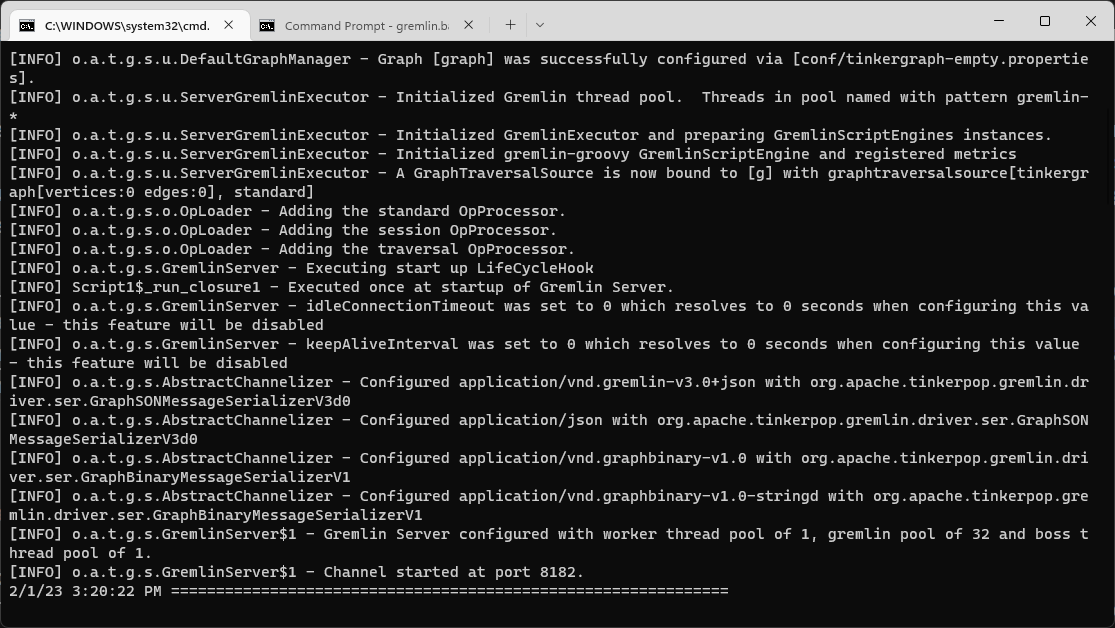
To get started I will be setting up the database using Apache TinkerPop and not CosmosDB due to cost and development speed. Will make use of Gremlin.NET - a wrapper around Gremlin Query Language. Let’s download Apache TinkerPop Gremlin Server and Console. These will be downloaded in .zip file, so extract them into a folder and navigate to the bin directory inside each extracted folder and using the command/shell prompt execute the .bat file if you’re on Windows else .sh file if you are on Linux or WSL on Windows.
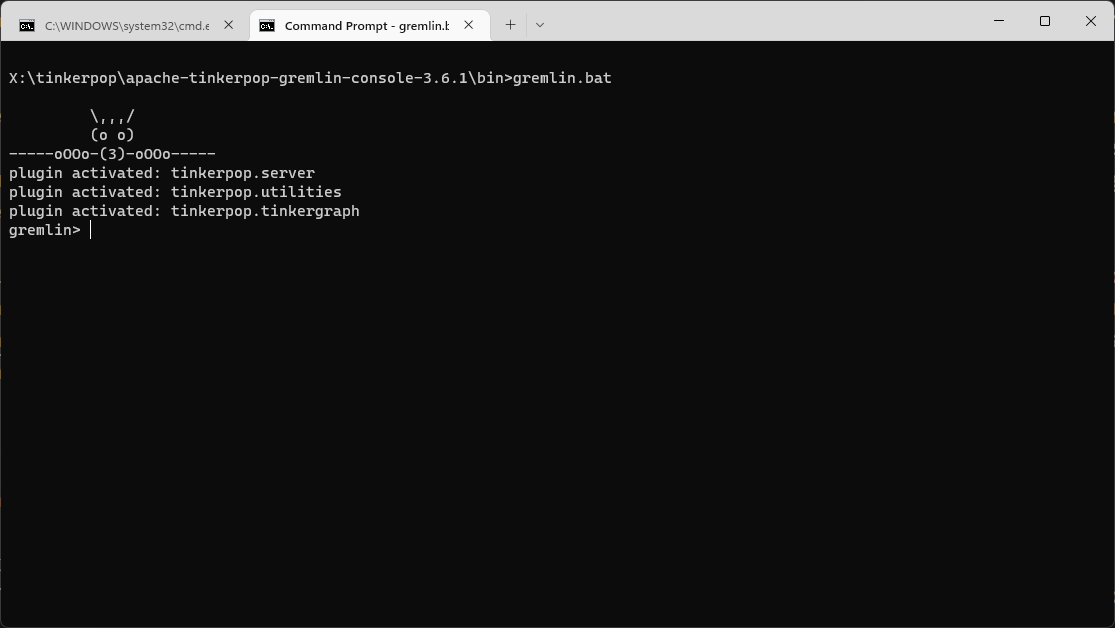
After both the server and console are running, go to console terminal window and connect to the local TinkerPop server. Note that the console is independent of the server running on the local machine. If you are assuming that it will automatically connect to the running local instance of the server, then you are wrong. Therefore, we have to connect to the local server instance by executing the below command in the Gremlin console.
gremlin> :remote connect tinkerpop.server conf/remote.yaml session
If you are unable to connect to the local server instance, then it might be a problem with your config file (.yaml) which you can find under conf folder in your console folder. Here are the contents of my remote.yaml file.
hosts: [localhost]
port: 8182
serializer: { className: org.apache.tinkerpop.gremlin.driver.ser.GraphBinaryMessageSerializerV1, config: { serializeResultToString: true }}
With connection established, now we can import the graphson data in the database. You can also refer to my Github repo where I have used the raw data from the web to generate the edges and vertices for all Marvel characters. The raw data which is in csv format has some repetitive connections. The repo code ensures that there are no duplicate connections. You can also refer to the code if you plan to connect and play with TinkerPop graph database. Running the code and setting up the database will be a bit time-consuming, so I would suggest to download the mcu.json file from the repo and then importing it, which will happen in a few seconds.
The data file which you downloaded from the repo mcu.json should be stored on the Gremlin server current working directory. After you place the file, execute the below command on the Gremlin console.
gremlin> :> g.io("mcu.json").read().iterate()
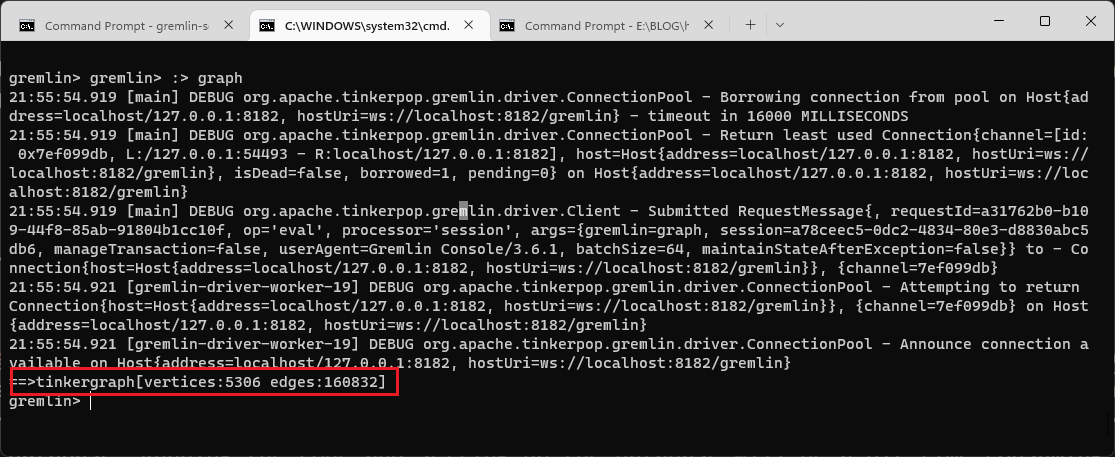
The above command will take a few seconds to execute and then it will return you back to the gremlin console. We can now verify the data by executing this command.
gremlin> :> graph
If all goes well, you should see the output below of the above command.
Let’s write some Gremlin queries and find out some information. Go to Gremlin console and test these below queries.
How many people does Cap know?
gremlin> :> g.V().has("name","CAPTAIN AMERICA").outE("knows").count()
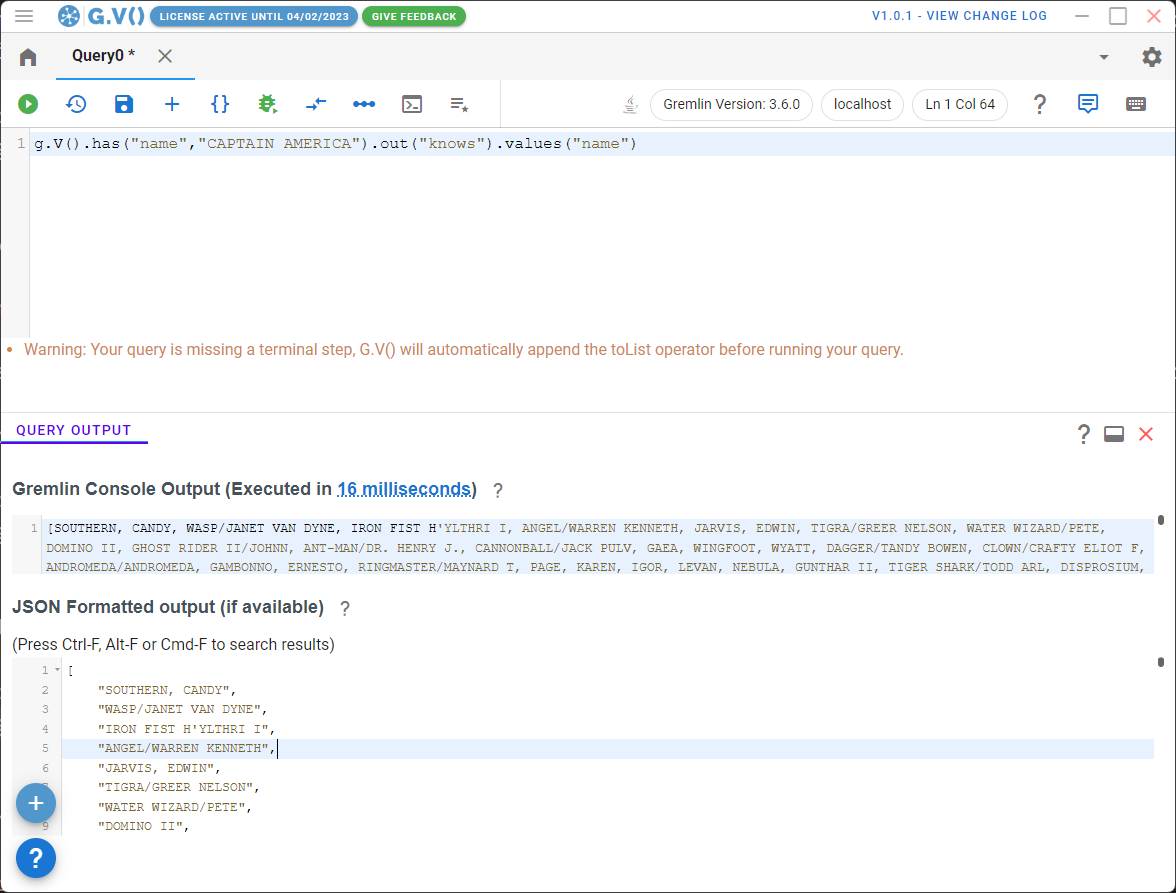
And who are those people?
gremlin> :> g.V().has("name","CAPTAIN AMERICA").out("knows").values("name")
Characters who have IRON in their name. Note that this is case-sensitive.
gremlin> :> g.V().has('name', containing('IRON')).values('name')
As this is a graph database, it will be nice if we can visualize the data visually. There are few visualization tools I have used so far and GDotV seems to a be popular one.
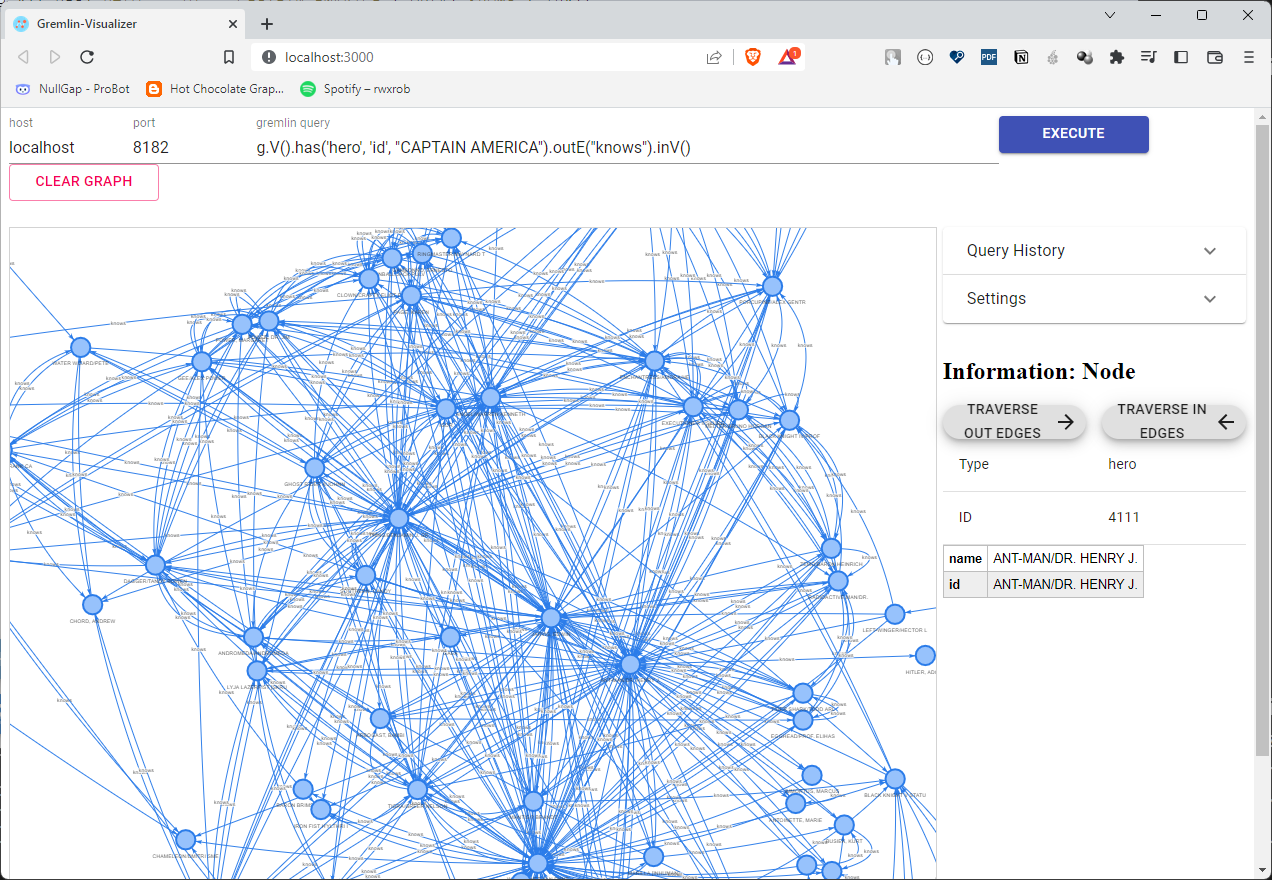
You can also visualize using this simple open-source graph visualization tool called gremlin-visualizer. There are other visualization tools as well in case you want to work with some advanced feature sets. I personally make use of the basic console and mix of gdotv gremlin-visualizer as it fits my needs. For example, you will be able to execute this query below and see the visualization in gremlin-visualizer but unable to get this query to execute in gdotv version 1.0.1.
g.V().has('hero', 'id', "CAPTAIN AMERICA").outE("knows").inV()
Reference & Resources