

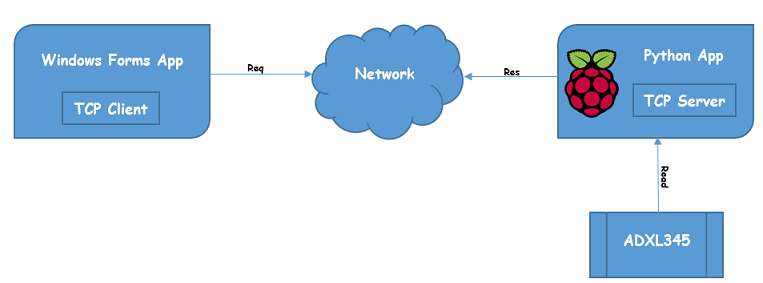
I have been playing a lot with Raspberry PI and Python these days and have also started a side project to create robot car controller with a Xbox 360 wireless controller. I am planning to controller a robot car using a custom interface from my Windows machine. Initially I tried with PyQt but I dropped the idea for now as Python is not my primary expertise and it will take some time for me to learn the basics and get into some serious coding. Controlling something remotely or visualizing the information from your device on the UI is always better. For a proof of concept I built a Windows Forms application which will request the output from Raspberry PI over TCP and then visualize it on the UI using a wonderful chart library that I found today. There is a slight change in the Python code as I have to transmit readings from Raspberry PI over TCP so my Windows Forms application can read the output and utilize it to visualize it.
Raspberry PI Python Application
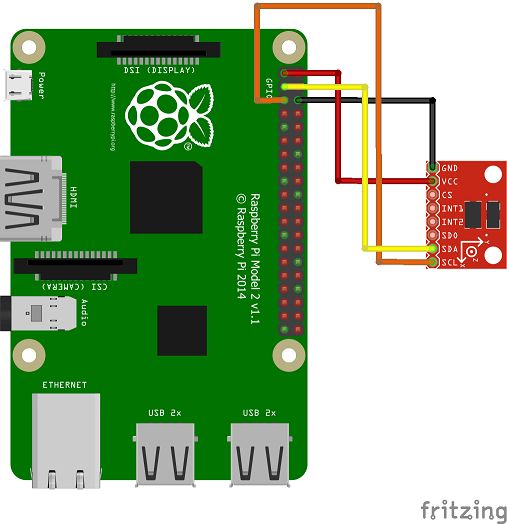
Reading the ADXL345 output is fairly simple and you can do this without any problem by using Adafruit’s ADXL345 Python library. This library will get you started in a jiffy and you will have your readings. I am not going into the details about the different features of the library I am using and ADXL345. The only thing you will have to do is to wire ADXL345 to your Raspberry PI and fire the example code you got from Adafruit’s repository from Github. If you have set it up correctly this, you will see X, Y, Z values on your terminal. If the terminal displays 0s for all the three axis then there is something wrong with the wiring (assuming you are using the example code). This is how your writing should be like.
Now I have made slight changes in the code so that I can send the data over TCP. I have created a simple TCP server which exposes Raspberry PI through IP address and a port number. This is the complete code for reading values from ADXL345.
import Adafruit_ADXL345
import socket

HOST = "192.168.1.8"
PORT = 50007

accel = Adafruit_ADXL345.ADXL345()

s = socket.socket(socket.AF_INET, socket.SOCK_STREAM)
s.bind((HOST, PORT))
s.listen(1)
conn, addr = s.accept()

while 1:
    data = conn.recv(1024)

    if data.strip() == "adxl":
        x, y, z = accel.read()
        data = 'X:' + str(x) + '|Y:' + str(y) + '|Z:' + str(z)
        conn.send(data)
In the code, you can see that I am not just transmitting the readings just like that. I only transmit when there is a request from another application is there to get the readings. This is a good approach as I don’t the PI to transmit the readings even if nobody is requesting it. I am sending a single string as a response which I am going to read at my Windows Forms application and use it.
You need to change the IP address and port number according to your Pi’s configuration.
Once this is done you can then execute the script from the terminal by firing the below command
sudo python adxl.py
This is it from Raspberry PI side. Let’s take a look from the Windows side now.
Windows Forms Application
This will be a simple Windows Forms application which will connect to the Raspberry PI using the Pi’s IP address and the port on which the server is running. The Windows Form application is also a TCP client which sends a request to Raspberry PI for the updated readings from ADXL345. As I mentioned above in the Python code that the readings are not just being transmitted but a client has to send a request to to get the readings.
Let’s get started with the visualizing part. While was searching for a perfect charting library, I came across this wonderful library called Live Charts. This library is open-source, easy to use, has lots of awesome charts and a very robust documentation and moreover it supports Windows Forms as well as on WPF applications. I highly recommend you to look at the examples to get the idea about this library.
As usual, I will be using Nuget command to install the library.
PM> Install-Package LiveCharts.WinForms
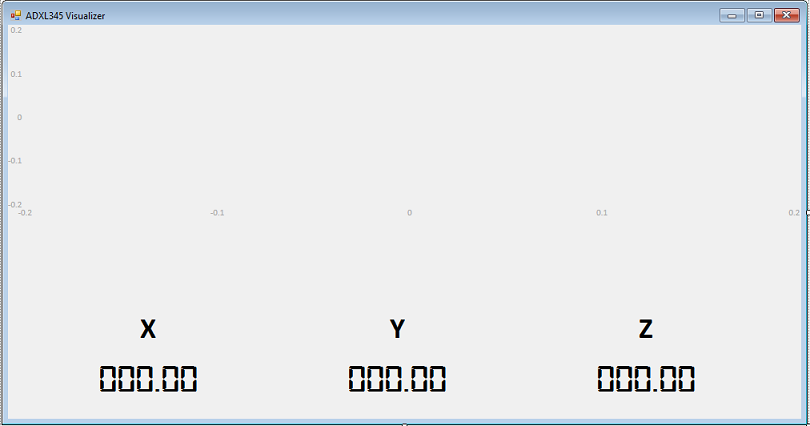
You also have to add the custom controls in the toolbox. You can follow the steps here to add the Live Charts control in the toolbox. In the design mode, choose the Cartesian Chart control from the toolbox and add it to the form. After adding the control to the form, I have dock it to the top of the form so I can utilize the lower section of the form to display the readings in numbers. Here is how my form looks like in design mode.
After the designing for the form is complete, I can initialize the chart to display the readings from Raspberry PI. The chart require few things to be setup before it can start displaying the data correctly. The accelerometer I am using is a 3-axis accelerometer and therefore it is going to send me readings for 3 axis i.e X, Y and Z. This means I will be needing 3 line series to visualize the information from accelerometer. To have 3 line series display the data I have to use CharValues class which will let me display the readings in the line series. As I have to update my chart when I request the new readings from Raspberry PI, I have to use ObservableValue type. The ObservableValue will make sure that whenever there is a change in the value, it gets reflected in the chart and therefore keeping the chart always up to date.
public ChartValues<ObservableValue> Values_X { get; set; }
public ChartValues<ObservableValue> Values_Y { get; set; }
public ChartValues<ObservableValue> Values_Z { get; set; }
Because I am going to make request to the server running on my Raspberry PI and request for the ADXL345 readings, I have to create a TCP client in order to do so.
Socket server;
IPEndPoint ipEndPoint;
byte[] data;
When the application is loaded, I want to make connection to Raspberry PI by using it’s IP address and port number on which the server is running on. To do this I will add the below code to the constructor of my application.
ipEndPoint = new IPEndPoint(
                IPAddress.Parse("192.168.1.8"), 50007);

server = new Socket(AddressFamily.InterNetwork,
               SocketType.Stream, ProtocolType.Tcp);

try
{
    server.Connect(ipEndPoint);
}
catch (SocketException)
{
    MessageBox.Show("Unable to connect to server.", "Error", MessageBoxButtons.OK, MessageBoxIcon.Error);
    return;
}
The above code is self-explanatory as I am just connecting to Raspberry PI.
In the form load event, I have to initialize chart values and add 3 line series to my CartesianChart for X, Y and Z axis respectively. In my case the name of the Cartesian Chart is ADXLViz.
Values_X = new ChartValues<ObservableValue>();
Values_Y = new ChartValues<ObservableValue>();
Values_Z = new ChartValues<ObservableValue>();

ADXLViz.Series.Add(new LineSeries
{
    Values = Values_X,
    Title = "X",
    StrokeThickness = 4,
    PointGeometrySize = 0,
    DataLabels = true
});

ADXLViz.Series.Add(new LineSeries
{
    Values = Values_Y,
    Title = "Y",
    StrokeThickness = 4,
    PointGeometrySize = 0,
    DataLabels = true
});

ADXLViz.Series.Add(new LineSeries
{
    Values = Values_Z,
    Title = "Z",
    StrokeThickness = 4,
    PointGeometrySize = 0,
    DataLabels = true
});
Play around with different properties in the LineSeries class and set the output that suits your need or your eye. Notice the Values properties in the LineSeries class which holds the value which is received from Raspberry PI.
I am requesting the readings from Raspberry PI every 500ms and to do this I am using a Timer class. This is easy to use and configure. Just drag and drop the Timer control from the toolbox. In the properties change the Interval property to 500 and Enabled to True. After this I set the Tick event which will request the new readings every 500ms.
string stringData;
server.Send(Encoding.ASCII.GetBytes("adxl"));
data = new byte[1024];
int recv = server.Receive(data);
stringData = Encoding.ASCII.GetString(data, 0, recv);
string[] adxl = stringData.Replace(" ", "").Split('|');

Values_X.Add(new ObservableValue(Convert.ToDouble(adxl[0].Split(':')[1])));
Values_Y.Add(new ObservableValue(Convert.ToDouble(adxl[1].Split(':')[1])));
Values_Z.Add(new ObservableValue(Convert.ToDouble(adxl[2].Split(':')[1])));

if (Values_X.Count > 10) Values_X.RemoveAt(0);
if (Values_Y.Count > 10) Values_Y.RemoveAt(0);
if (Values_Z.Count > 10) Values_Z.RemoveAt(0);

X_Label.Text = Convert.ToString(adxl[0].Split(':')[1]);
Y_Label.Text = Convert.ToString(adxl[1].Split(':')[1]);
Z_Label.Text = Convert.ToString(adxl[2].Split(':')[1]);
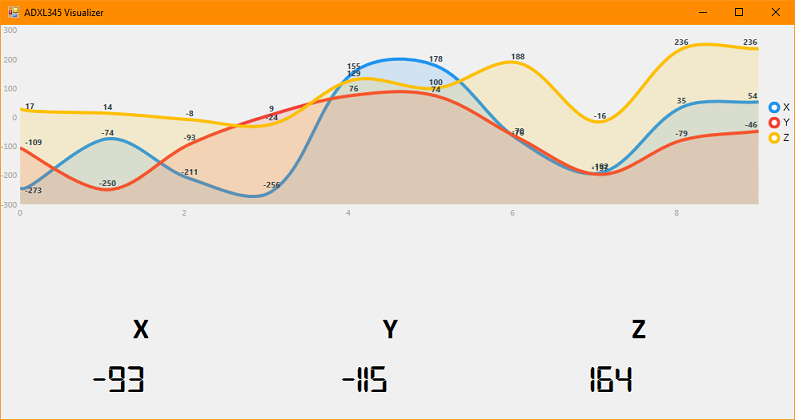
The stringData variable holds the response or reading which is received from Raspberry PI. If you check the Python code above you will see that the response is being sent in a single string called data. I am splitting the string here and extracting the values and setting it to ChartValues<ObservableValue> object. This will render all the 3 line series chart and update it with the readings received from PI. But the problem here will be that in few minutes the chart will be hard to see due to lot of data congestion in chart. In order to overcome this problem, I have removed the first value from all the 3 line series when the chart displays more than 10 values. You can change the value from 10 to whatever suits you.
The overall idea of building this application is to see whether it is possible or easy to communicate from Raspberry PI apart from using frameworks like WebioPI or Flask. The complete source code for Raspberry PI and Windows Forms application is available on Github along with Fritzing sketch file and additional instructions to install the dependencies.